.jpg)
HAP Journal of Public Health and Clinical Medicine

 Search
1 SP Fort Hospital, Thiruvananthapuram, Kerala, India
2 Government Medical College, Thrissur, Kerala, India
3 Health Action by People, Thiruvananthapuram, Kerala, India
4 Government Medical College, Thiruvananthapuram, Kerala, India

Creative Commons Non Commercial CC BY-NC: This article is distributed under the terms of the Creative Commons Attribution-NonCommercial 4.0 License (http://www.creativecommons.org/licenses/by-nc/4.0/) which permits non-Commercial use, reproduction and distribution of the work without further permission provided the original work is attributed.
Background: India is initiating measures to address Chronic Obstructive Pulmonary Disease(COPD) and Asthma, major causes of mortality and morbidity, at the primary care level. The efforts are limited by the lack of access to spirometry. Various alternatives are being tried out in resource limited countries.
Methods: A hospital based cross-sectional study was done at two tertiary care hospitals in Trivandrum, South India, in patients with a clinical diagnosis of COPD or Asthma. Spirometry was done by a trained spirometry technician, along with peak-flow recording and a recording on portable mini-spirometer (COPD6 ®). The values obtained by the latter two were compared to those obtained by spirometry.
Results: The study included 360 patients. PEFR showed a positive correlation with both FEV1/FVC as well as FEV1 (R2 of 0.35 and 0.65, respectively). FEV1/FEV6 and FEV1 on COPD6 also correlated positivity with FEV1 and FEV1/FVC on spirometry (R2 of 0.68 and 0.89, respectively). Sensitivity and specificity of PEFR to diagnose obstruction was best at a cut-off of 74% of predicted, as determined by ROC, giving sensitivity of 84.8% and specificity of 85.1%. Sensitivity and specificity of COPD6 to detect obstruction was 75.9% and 95.7%, respectively.
Conclusion: Mini-spirometry (COPD6) and peak-flow measurement may be used as alternatives to spirometry in resource limited settings as in the primary care centers of India for the diagnosis of obstructive airway diseases.
Pulmonary disease, chronic obstructive, Asthma, respiratory function tests, prevention and control, Kerala
Introduction
Obstructive airway diseases, particularly Chronic Obstructive Pulmonary Disease (COPD) and Asthma, are major causes of mortality and morbidity in India and the world. Worldwide, COPD is the third leading cause of mortality, whereas in India COPD is the second leading cause of mortality.
COPD is defined as
A common, preven table and treatable disease that is characterized by persistent respiratory symptoms and airflow limitation that is due to airway and/or alveolar abnormalities usually caused by significant exposure to noxious particles or gases and influenced by host factors including abnormal lung development. Significant comorbidities may have an impact on morbidity and mortality.1
Asthma is a heterogeneous disease, usually characterized by chronic airway inflammation. It is defined by the history of respiratory symptoms such as wheeze, shortness of breath, chest tightness, and cough that vary over time and in intensity, together with variable expiratory airflow limitation.2
The global prevalence of COPD is estimated by Global Burden of Disease (GBD) 2019 as 212 million and deaths as 3.28 million. The global prevalence of Asthma is estimated by GBD 2019 as 262 million and deaths as 0.46 million.3 The prevalence of COPD as per GBD 2019 was 37.87 million and that of Asthma 34.3 million. The deaths due to COPD were estimated to be 898,444 and those due to Asthma to be 199,798.4 While India accounts for 13% of the global prevalence of Asthma, it accounts for 43% of the global Asthma mortality. Similarly, more than 90% of COPD-related deaths occur in Low middle income countries (LMICs).
One among the important aspects to consider when addressing the global economic burden of COPD is the underdiagnosis.5 Evidence suggests that COPD is underdiagnosed in primary care settings, with most cases being identified during an exacerbation or after significant loss of lung function.6 LMICs face unique challenges when addressing COPD, including poorly resourced primary care systems and trained workforce shortages, which present challenges with COPD diagnosis and management, especially during exacerbations.7
Spirometry remains the “gold standard” for COPD diagnosis. A triad of typical symptoms, exposure to noxious gases or particles and specific spirometry results are essential for the diagnosis of COPD.1 Similarly, spirometry is essential for the diagnosis of Asthma. Global initiative for Asthma (GINA) guidelines recommend either spirometry or peak flow measurements for the diagnosis of Asthma.2 Despite the recommendations by these two guidelines, the proportion of patients undergoing these essential tests remain low in India. Two nation-wide surveys done in India showed an increase in the use of spirometry between 2005 and 2013, but despite the increase only 18% of general practitioners used spirometry for the diagnosis of their COPD/Asthma, the percentages being higher for physicians (26%) and respiratory physicians (72%).8 A study done in Trivandrum, India, showed that only 18% of patients had undergone a spirometry when they reached tertiary care for further evaluation. A high proportion of patients were not even told the diagnosis of their disease.9
Until recently, COPD and Asthma were not addressed at primary care level in India. The national program for non-communicable diseases for India, the National Programme for Prevention and Control of Cancer, Diabetes, Cardiovascular Diseases and Stroke (NPCDCS), only addressed COPD in brief focusing more on preventive strategy than on diagnosis.10 However, recently the NPCDCS has released its strategy for the diagnosis and management of Asthma and COPD. This guideline proposes to use peak flow measurement as a means for diagnosis of Asthma and COPD.11 Prior to this, the government of Kerala state in South India had launched its own program for the prevention and management of COPD and Asthma, called the “SWAAS” program (Stepwise Approach to Airway syndromes). This program uses a mini-spirometer for the diagnosis of Asthma and COPD.
Hence, in the Indian context, these is gross underuse of spirometry, an essential test for the diagnosis of COPD and Asthma. The ongoing SWAAS program used a mini-spirometer as a replacement for spirometry, whereas the upcoming NPCDCS proposes to use Peak flow measurements. In this context, we evaluated how these two methods of pulmonary function assessment would compare to the gold standard, which is spirometry.
Methods
A hospital based cross-sectional study was done at two tertiary care hospitals in Trivandrum city in South India, one in the government sector and one in the private sector. Patients with a clinical diagnosis of COPD or Asthma at these hospitals at the Pulmonary Medicine departments undergoing spirometry were included. Spirometry (using Vitalograph Pneumotrac™) was done by a trained spirometry technician. A trained health worker performed peak-flow recording using a peak flow meter (Breath-O-meter ®) as well as a portable mini-spirometer (COPD6 ®). Three measurements were made for the patient on the same day with each apparatus and the best of the three values was taken for each apparatus. The forced expiratory volume in the first second (FEV1) was obtained both for the spirometer and the COPD6. For the spirometer, the forced expiratory volume (FVC) was obtained, whereas for COPD6, the forced expiratory flow in the first six seconds (FEV6) was obtained. For the Peak flow recording, the peak expiratory flow rate was recorded. The normal PEFR was predicted using the Indian prediction algorithm (PEF in L/minute [male] = 69.259 – 2.290 [age] + 2.888 [height], and PEF in L/minute [female] = 168.551 – 1.776 [age] + 1.354 [height]).12 The ratios of FEV1/FVC were calculated for spirometry and FEV1/FEV6 for COPD6. A fixed cut-off of 70% was used to determine obstruction. A PEFR of 80% was taken as the measurement for obstruction while performing peak flow. The sensitivity and specificity of the portable mini- spirometer (COPD6 ®) (with FEV1/FEV6 <70%) and the mini spirometer (predicted peak expiratory flow rate (PEFR) < 80%) in diagnosing airflow obstruction was determined with the full spirometry (FEV1 / FVC < 70%) as a gold standard. Correlation was done for the FEV1 values on spirometry with FEV1 on COPD6 and PEFR. Data was analyzed using EpiInfo 7.2.4.0 (CDC Atlanta). Receiver operating characteristic (ROC) curve was plotted for determining the best cut-off of PEFR for predicting obstruction defined as FEV1/FVC<70% on spirometry using the easyROC web-tool.13 Patients were recruited after written informed consent and Ethics Committee clearance was obtained from the Independent Ethics Committee at Health Action by People.
Results
Results of Spirometry, COPD6 and peak-flow recording were available for 360 patients being evaluated for Asthma and COPD. The mean age of the patients was 41.8 years with a standard deviation of 17.4 years (median – 42 years, interquartile range 27-55). A total of 209 (58.1%) patients were females. The PEFR values were correlated with FEV1/FVC on spirometry and also with the FEV1 (Figure 1A and Figure 1B). There was positive correlation between the FEV1/FVC ratio and the PEFR with an R2 of 0.35. There was a positive correlation between FEV1 on spirometry and PEFR with an R2 of 0.65. The FEV1/FVC values on spirometry were correlated with FEV1/FEV6 on COPD6 (Figure 1C). There was positive correlation between FEV1/FVC on spirometry and FEV1/FEV6 on COPD6 with an R2 of 0.68. The FEV1 values on spirometry were correlated with FEV1 on COPD6 (Figure 1D). There was positive correlation between FEV1 on spirometry and FEV1 on COPD6 with an R2 of 0.89.
Figure 1. Correlation Between Values Obtained on Peak-Flow Measurement and Measurements on COPD6 with the Corresponding Values on Spirometry. (A) Correlation between PEFR Measured on Peak-Flow Meter with FEV1/FVC Measured on Spirometer. (B) Correlation between PEFR Measured on Peak-Flow Meter with FEV1 Measured on Spirometer. (C) Correlation between FEV1/FEV6 Measured on COPD6 with FEV1/FVC Measured on Spirometer. (D) Correlation between FEV1 Measured on COPD6 with FEV1 Measured on Spirometer.

Abbreviations: PEFR, peak expiratory flow rate; FEV1, forced expiratory volume in the first second; FVC, forced vital capacity; FEV6, forced expiratory volume in six seconds.
The predicted PEFR was calculated for all the patients using the Indian algorithm. The sensitivity and specificity of the PEFR to detect obstruction (FEV1/FVC on spirometry < 70%) was calculated with both PEFR of 70% and 80% to predict obstruction. Similarly the sensitivity and specificity of the FEV1/FEV6 (<70%) to detect obstruction (FEV1/FVC on spirometry < 70%) was calculated (Table 1). ROC curves were plotted to determine the best cut-off of percentage predicted of PEFR to detect obstruction (Figure 2). The area under the curve (AUC) was - 0.91 (95% CI 0.88, 0.94). The best cut-off for percentage predicted PEFR to predict obstruction (using the Youden cut-off method) was 0.74 which gave a sensitivity of 84.8% and specificity of 85.1%. ROC was also plotted to determine the best cut-off of FEV1/FEV6 so as to determine obstruction (as defined by FEV1/FVC on spirometry less than 0.7) (Figure 3). The area under the curve was 0.96 (95% CI 0.93, 0.98). The optimal cut-off was determined as 0.71, which gave a sensitivity of 87.3% and specificity of 93.6%.
Figure 2. ROC Plot of Percentage Predicted of PEFR for Determining Obstruction on Spirometry.

Abbreviations: ROC, receiver operating characteristic curve; PEFR, peak expiratory flow rate; obstruction, FEV1/FVC ratio less than 70% on spirometry; AUC, area under the curve.
Note: AUC = 0.91 (95% CI 0.88, 0.94); P value < .001.
Figure 3. ROC Plot of FEV1/FEV6 Ratio as Opposed to Obstruction Determined on Spirometry with a Cut-off of 0.7.

Abbreviations: ROC, receiver operating characteristic curve; PEFR, peak expiratory flow rate; obstruction, FEV1/FVC ratio less than 70% on spirometry; AUC, area under the curve.
Note: AUC = 0.96 (95% CI 0.93, 0.98); P value < .001.
Table 1. Sensitivity and Specificity of Peak-Flow Recording and COPD6 to Detect Obstruction (FEV1/FVC < 70% on Spirometry).

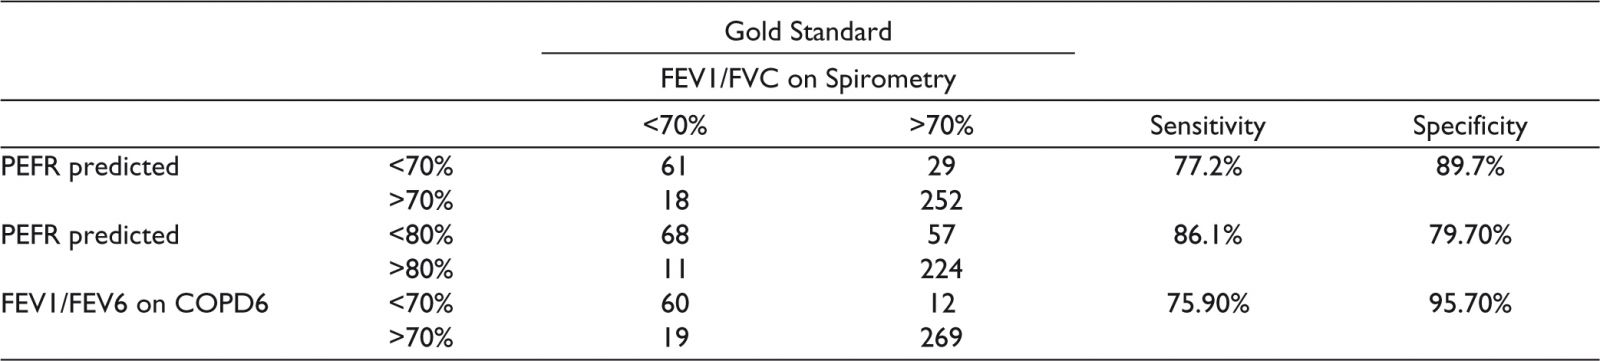

Abbreviations: PEFR, peak expiratory flow rate; FEV1, forced expiratory volume in the first second; FVC, forced vital capacity; FEV6, forced expiratory volume in six seconds.
Discussion
This study evaluated the values obtained on spirometry, COPD6, and peak-flow recording for evaluation of patients for Asthma and COPD. Spirometry is considered the gold standard and an essential investigation for the diagnosis of Asthma and COPD. However, the access to spirometry remains poor in India. In this context, other simpler tests have often been considered for the diagnosis of COPD and Asthma in resource limited settings as in India.
A study from China, with 2445 participants undergoing six different means of identifying COPD, including various questionnaires and tests, including COPD6 and peak-flow measurement, showed a sensitivity of 64.9% and specificity of 89.7% for COPD6 as compared to a sensitivity of 67.3% and specificity of 82.6% for peak-flow measurement.14 These are slightly lower than those obtained by this study. Salvi et al evaluated peak-flow along with a questionnaire for the diagnosis of obstructive airway disease and showed a sensitivity of 84% and specificity of 93% at a cut-off of <80% of PEFR.15 This has now been included as an alternative in resource limited settings in the GOLD guidelines.1
Public health strategies for addressing COPD and Asthma at primary care level were not there in India until a few years back. The first attempt at addressing COPD and Asthma at primary care level was made in the SWAAS program in Kerala. This program bases its diagnosis of COPD and Asthma on COPD6. The initial evaluation of the program showed a high proportion of Asthma and COPD patients now undergoing a COPD6 test before diagnosis, as compared to the primary health centers where the program was not yet implemented.16 However, this study did not evaluate whether the tests were optimally performed or interpreted.
In 2021 November, the government of India released detailed guidelines for diagnosis and management of COPD and Asthma at primary care as part of its NCD guidelines. This based the diagnosis and management of COPD and Asthma at primary care on peak-flow measurement.11 The cut-off 80% of predicted PEFR has been used to make provisional diagnosis of COPD and Asthma at the primary health center level. Provision for spirometry has been proposed at higher levels. This strategy would make objective assessment of COPD and Asthma possible at primary care level, but as opposed to mini-spirometry (COPD6) used in the SWAAS program, such a diagnosis would have lower specificity. Hence the positive predictive value would be lower. In a country like India, where the inhalers required for the treatment for COPD and Asthma are either not available at primary health centers or where there is a huge gap between the availability of medications and the huge number of patients with Asthma and COPD, tests with greater specificity may be more appropriate as these will ensure that medications, scarcely available, would be used for patients who actually have the disease.
However greater clarity is required on what would be a good test at primary care level in resource limited settings. While spirometers predict the normal for the various values based on computerized algorithms, different for north Indians and south Indians, the nomograms for PEFR seem to have low R2. The optimal cut-off for PEFR for diagnosis of obstruction may also need reconsideration. This study suggests that a cut-off of 74% may give the best results, however the National guidelines stick to the traditional cut-off of 80%. A nation-wide multi-centric study relooking into the nomogram for PEFR as well as the ideal cut-off of PEFR to diagnose obstruction may give better guidance to policy. A mini-spirometry, which is used in the SWAAS program in Kerala could give a sensitivity of 87.3% and specificity of 93.6% at a cut-off of 0.71. The current cut-off used in the SWAAS program is 0.7, which is not very different from this. Salvi et al had suggested a cut-off of 0.75 for FEV1/FVC, but the best cut-off in this study was slightly different. A multicentric study, with a similar methodology could resolve this issue of what would be a ideal cut-off when using a mini-spirometer for the diagnosis of COPD.
The strength of this study is that it compares both the alternative methods of testing against the gold standard in a fairly large number of patients. The limitations include the fact that the testing was done in a tertiary care center, by a technician well trained and experienced in spirometry. Since these tests are effort dependent and results vary according to the skill of the technician, the same results may not be obtained at a peripheral institution. There is need for performing the same comparison at primary care level, with the COPD6 and peak-flow being performed by the PHC staff and comparing these with the spirometry performed by a technician.
Conclusion
Mini-spirometry and peak-flow measurement for the diagnosis of obstructive airway diseases have reasonable sensitivity and specificity (64.9% and 89.7% for mini-spirometry; 67.3% and 82.6% for peak flow reading, respectively, based on a fixed cut-off). There was better correlation between FEV1 on mini-spirometry with the corresponding value on spirometry as opposed to the PEAK flow recording. ROC plotted for PEFR showed that the best cu-off for determining obstruction was 0.74, which gave a sensitivity of 84.8% and specificity of 85.1%. Peak flow measurement and mini-spirometry can be replacement for full spirometry in resource limited scenarios.
Declaration of Conflicting Interests
The authors declared no potential conflicts of interest with respect to the research, authorship, and/or publication of this article.
Funding
The authors received no financial support for the research, authorship, and/or publication of this article.
